Dashboards
In this section the user can access, create and modify custom dashboards based on the execution of multiple queries and visualize the results as custom charts.
First add a new dashboard providing a name and a description, then click on the card to open the dashboard.
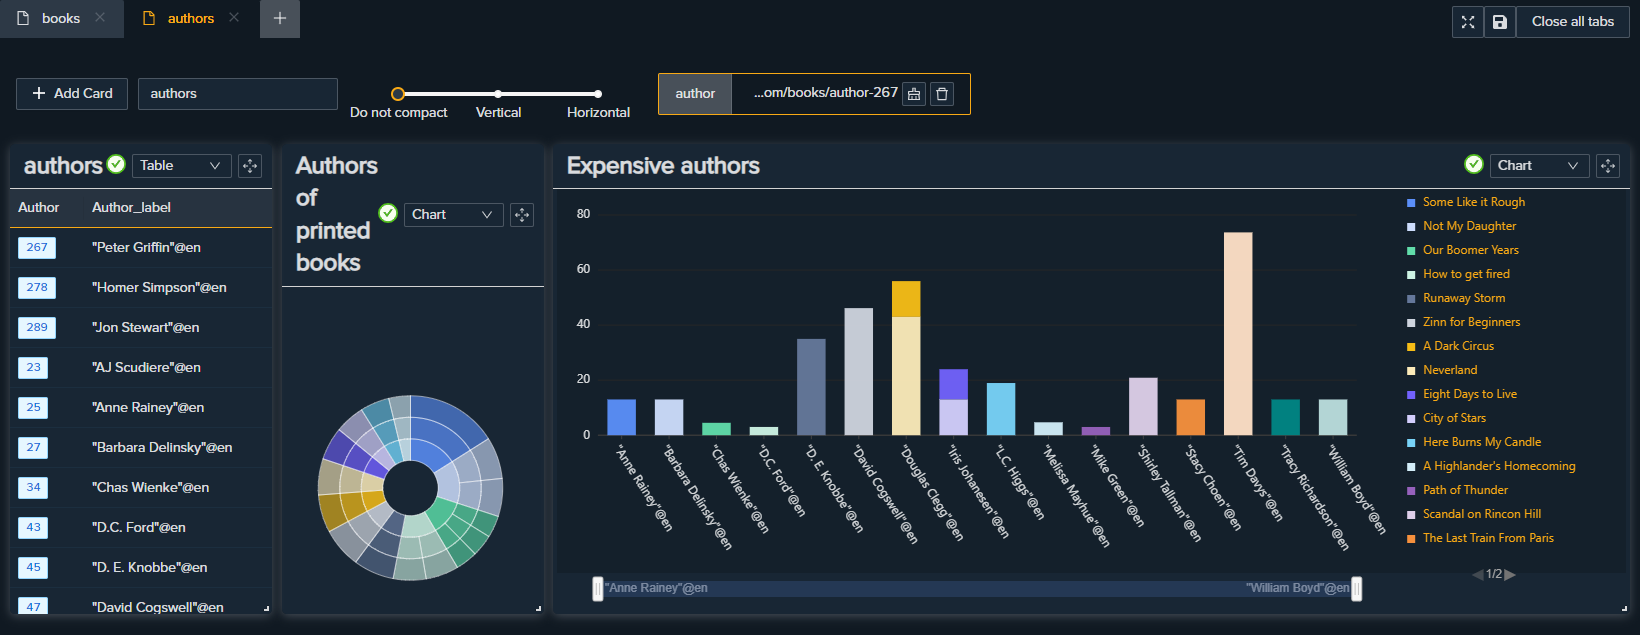
Dashboard layout
The dashbard layout is composed by several tabs where each tab has multiple cards. Each card represent a query and the chart associated to it.
Every change must be saved using the save button:

Toolbar

Using the toolbar you can:
- add a new card to the current tab
- rename the current tab
- change how the layout compact the cards
- see the filters currently being applied to the cards
Cards
Each card has a three views:
- Chart: where you can view the results of a query as a chart
- Table: where you can view the results of a query as a table
- Settings: where you choose the query and the params to visualize
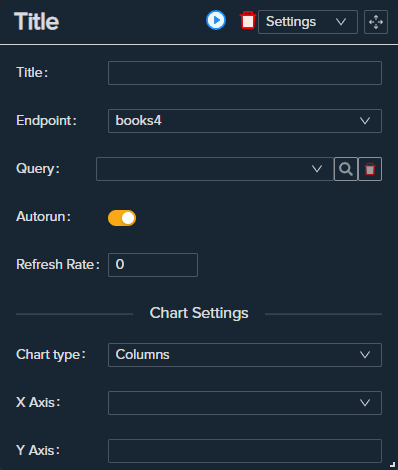
Settings
The setting of the cards are structured as follow:
- Title: the title of the card
- Endpoint: on which endpoint you want to run the query
- Query: the query (selected from the Query Builder Catalog). Furthermore here you can add or remover other filters on the selected queries based on the selection ofother cards.
- Autorun: wheter or not the query should run automatically (on selection of the query and on the opening the tab)
- Refresh rate: wheter the query should run every x milliseconds
- Chart settings: the same settings explained here
- Parameter settings: here you can export a parameter from this card which means that another card can use this parameter as a filter and update its query for a more specific query
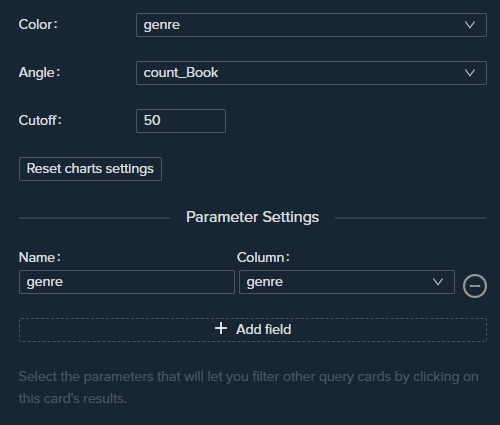
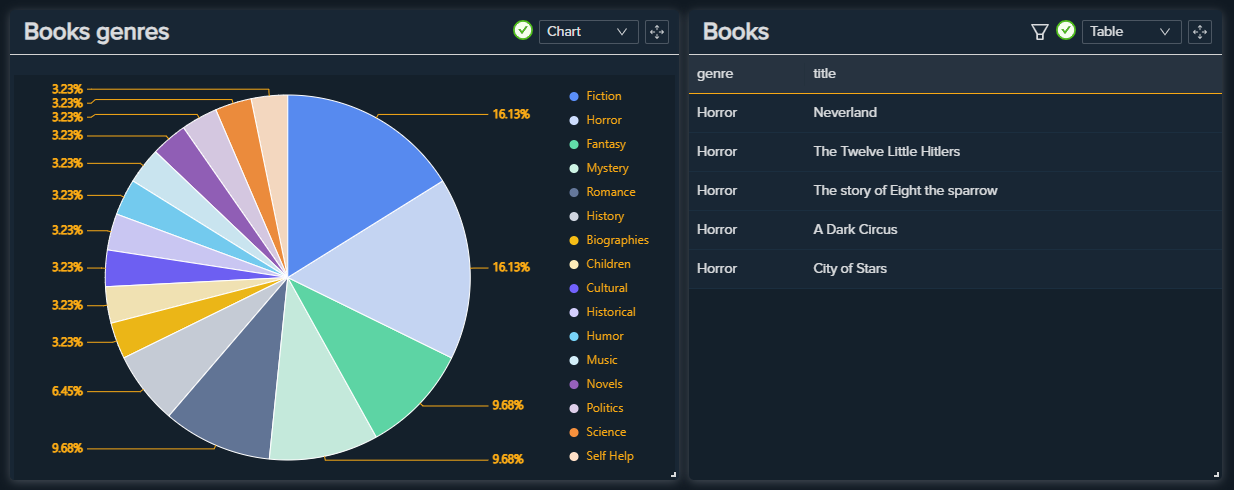
For example:
This query ask for the number of books grouped by genre. Choosing
genreas paramtere will enable the clicking of the pie sectors for a certain genre. The second card just ask for all the books title along with their genre. But on the second card there is a filter on data propertygenrethat is linked to thegenreparameter. So the click of the genre on the pie will result to an updated query filtering only the books with the clicked genre.

Filters
You can add a ne filter using a certain parameter (defined in another card), just by clicking on the magnify button in settings of a card. Then you need to select a class or a data property you want to filter and finally choose a defined parameter. This card will run the query with the correct filter every time the parameters used change. You can unset or delete the parameters from the toolbar.
Previous Next