Results
The query results, available as soon as the query starts producing rows, can be browsed in SPARQL Queries or Graphical Queries. There two visualizations (tabs) for the results:
Table
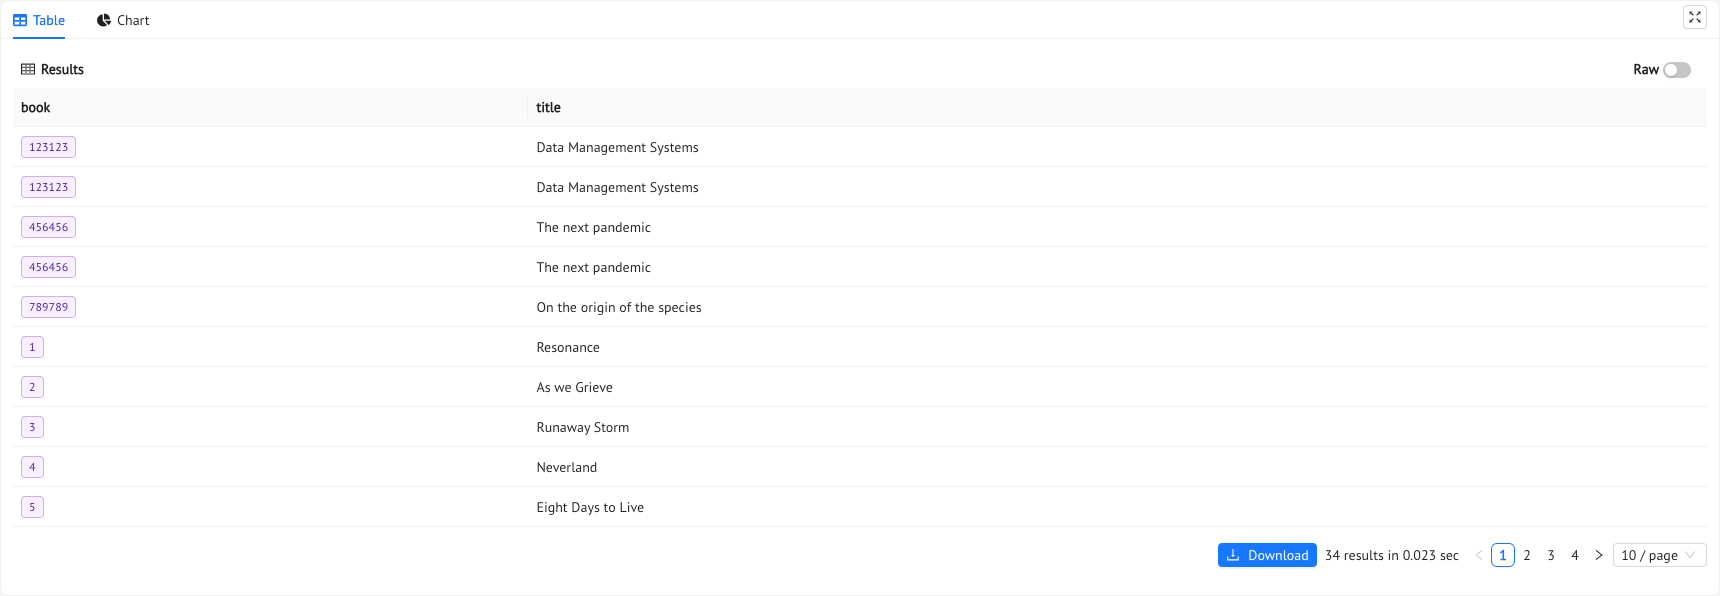
This is the standard visualization for the results. In order to manage large results set, the visualization is paginated. The user can change the size and the page in the bottom part of the table. The results can also be downloaded through the download button.
If there are any object individual in the results rows, the will be reported with purple tags; to see the full IRI just hover them. You can also start a new navigation in the VKG through the Show in VKG button.
Chart
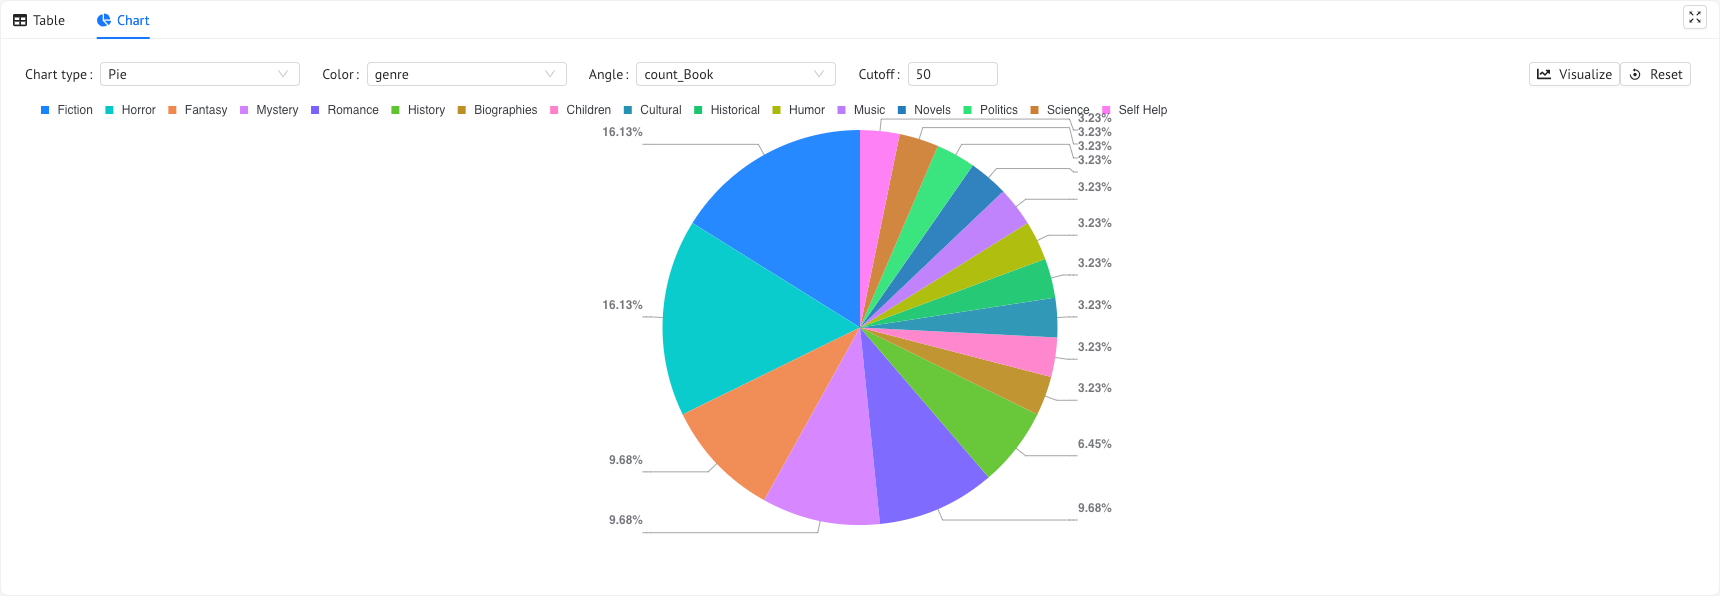
In this tab you will create a BI visualization with only a few clicks!
The first selection choose the chart’s type (pie, bars, columns and others ). This choice will change the rest of the form items that can be:
- X Axis: select the query column from which you want the chart to take the values of interest
- Y Axis: select the query columns that represent the amount to be visualized. The values must be numbers. This values will be the height of a column (bar) and a specific color will be assigned for each column.
- Series Field: select the query column you want to determine the color of the column (bar)
- Cutoff: consider only first n results
- Color: select the query column of interest that will be the colors of a pie
- Angle: select the query column that will be used to calculate the angle of the piece of cake
- Hierarchy: select the query columns (ordered) to be considered in the levels of a sunburst chart
If you want to collect charts and make them interactive one with another check out the Dashboards on Monolith-express!
View in VKG
In case you execute a CONSTRUCT the Chart tab will be replaced by a View in VKG tab. By clicking it you will be redirect to the VKG page with the results viewed as a graph. Here you can continue your navigation of the VKG using its capabilities.
Previous Next