Mapping Graph
The Mapping Graph is the graphical environment for the inspection and editing of SQL Views and Entity Mappings. Here indeed you can see represented all the elements involved in the definition of the Mappings, add new ones and edit or delete the existing ones.
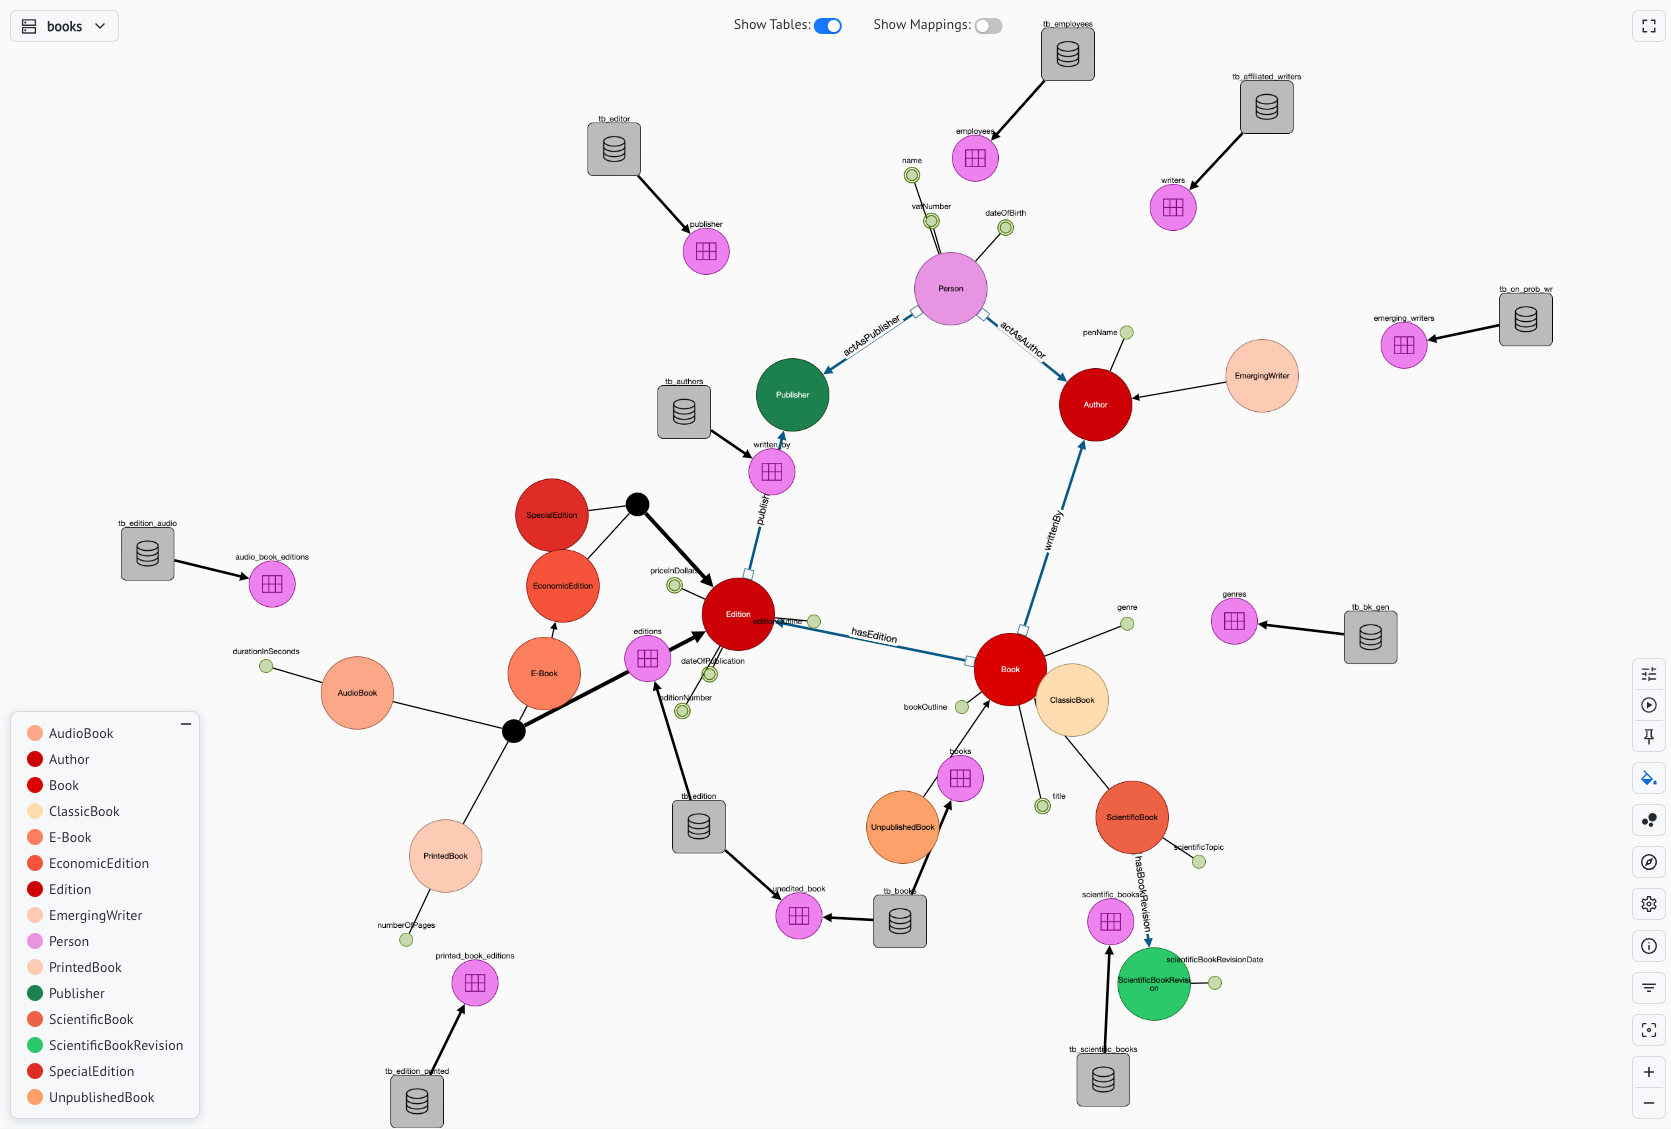
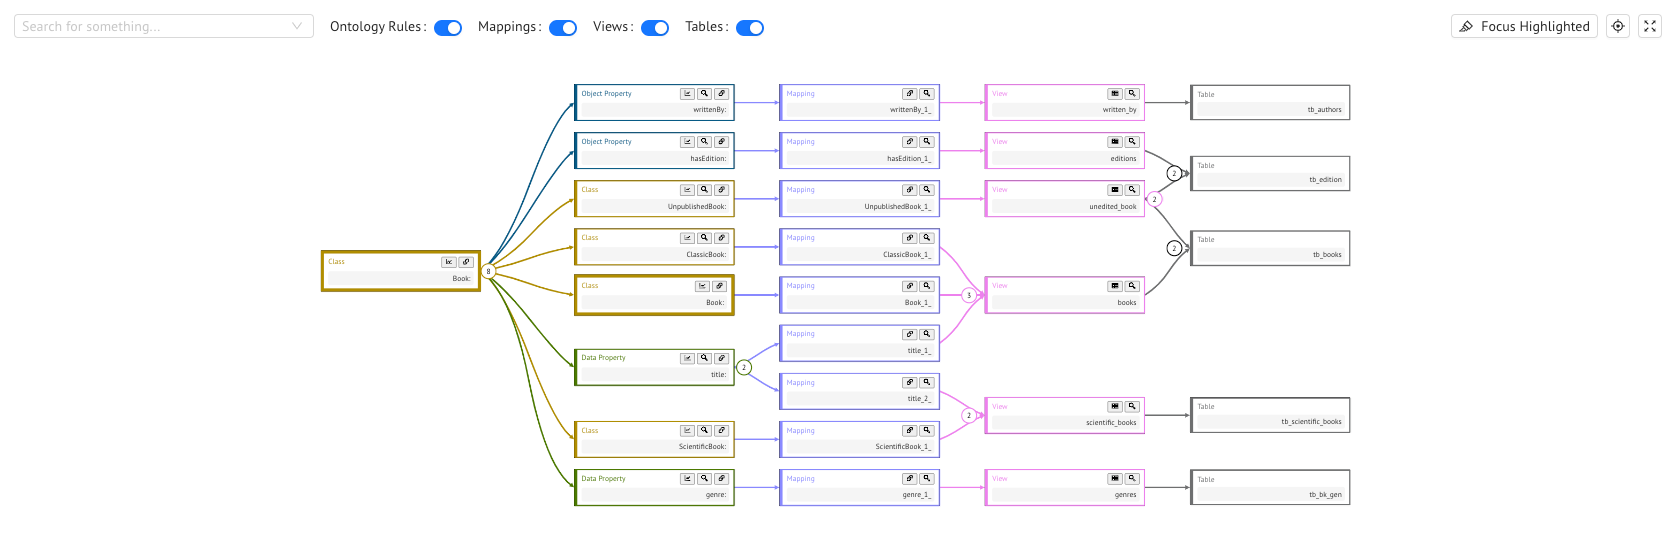
In the Mapping Graph you will find the following elements:
- Entities, that are the ontology entities, always represented in the Floaty Rendering;
- Views, that are the SQL views;
- Mappings, that are the mappings defined between the entities and the views;
- Tables, that are the database tables from which you can retrieve the views (available only if a default datasource is selected).
Having a graphical representation of mappings helps you better understand the connections between the underlying data and the ontology concepts. It also makes the definition of new views or mappings more intuitive. Moreover it makes it easy to spot the ontology entities that are not yet mapped to the data; these entities will indeed appear of a darker color.
On the side of the graph you also find a summary tab for each of these categories to help you navigate the graph.
Views
Views Tab
In the Views Tab you can find the listing of all the views of the current ontology mappings. By clicking the + button, you can add a new SQL view.
In the graph you will only see the views that are involved in at least one mapping. In case you want to add a view node to the graph, you can hover over the corresponding listing item and add the view to the graph. By doing so, you can also edit it or delete it.
View Node commands
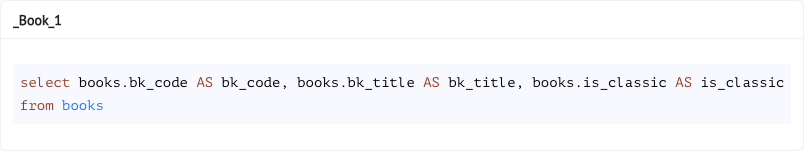
Once you have the view node in the graph, you can see the view preview and also all the mapping edges connected to that node by simply clicking on it. With a right-click instead you can access a few more commands.
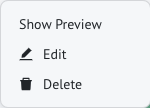
You can indeed edit or remove the view, but also, by clicking the + button, you can draw a new mapping edge. In this case you will find the mapping form pre-compiled for what concerns both the entity and the SQL code.
Mappings
Mappings Tab
In the Mappings Tab you can find the listing of all the defined mappings. By clicking the + button, you can add a new mapping.
As for the views, by hovering on a listing item, you can edit or delete the corresponding mapping.
Mapping Edge commands
Don’t worry if at the beginning you see no mapping edges, they are just hidden. You can toggle the visibility of a mapping edge by clicking on the view or entity node it is linked to.
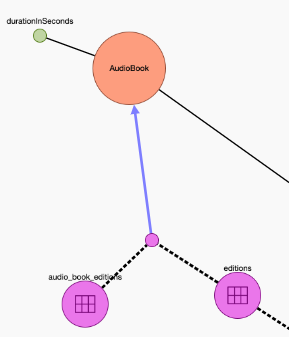
Notice that a mapping can also involve more than one view. In that case you will find the mapping edge connected to a join node, as you see above.
Once the mapping edge is visible, you can see its preview by clicking on it, while with a right-click you access a list of commands.
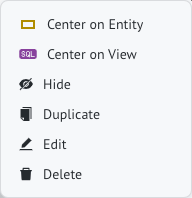
You can obviously edit or delete the mapping, but you can also duplicate it. In addition, in case of crowded graphs, the center commands come in handy as you can easily reach the entity or the view the mapping refers to. Also, you can choose to hide the current mapping edge.
Entities
Entities Tab
In the Entities Tab you find all the entities of the ontology and you can easily spot the ones with no mappings. In order to find them in the graph and add new mappings, you can simply click on the listing items.
Entity Node commands
As for the view nodes, clicking on an entity node will show you the entity details as well as all the mapping edges connected to it. You can draw new ones by clicking the + button.
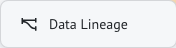
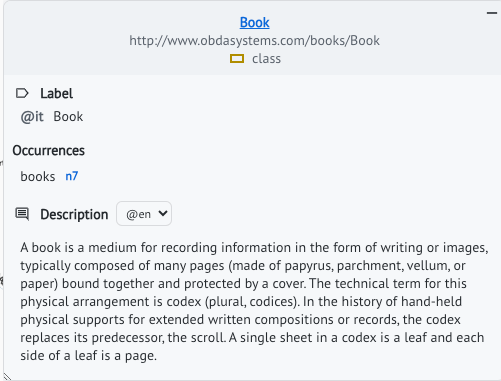
With a right-click you can instead access the entity Data Lineage to explore the path from the data to the entity.
Tables
Tables Tab
You also have a Tables Tab that will only be populated if you select a datasource in the top-right menu. When you specify the datasource, you can find all of its tables in the tab, in addition to all the tables involved in the SQL views.

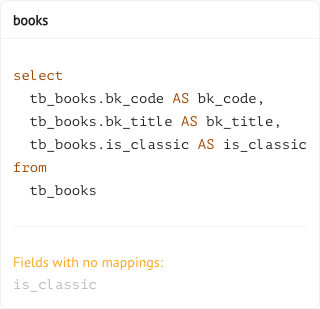
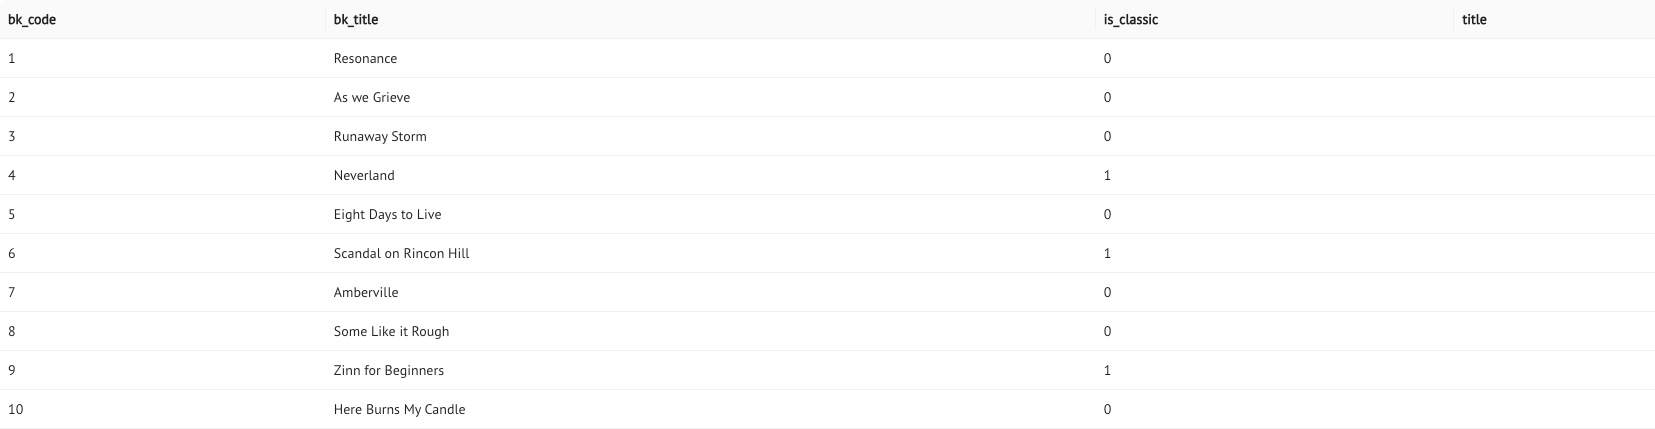
Once you have the listing of tables, by hovering over an item, you can choose to see the table preview. This way you can see all the columns it involves and have a look at the type of data it contains.
Table Node commands
You can decide whether to include the table nodes in the graph or not by toggling the Show Tables button. In case they are visible, you see each table node connected to all the views that are retrieved from that table.
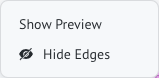
In the contextual menu you have the possibility to hide the node edges and also to show the preview of the table data.
Previous Next